Your Live Trading Dashboard
Header tape
The header tape is the scrolling ticker strip at the top of Mission Control. It shows live prices and percentage changes for the MAG 7 equities (AAPL, MSFT, NVDA, AMZN, META, GOOGL, TSLA) and major crypto pairs, giving you an at-a-glance read on the market’s biggest names without taking up panel space. Each ticker in the tape is clickable. Click any symbol to open the Setups Table filtered to that symbol across all timeframes — the same deep-link behavior you get from the Setups Feed and Earnings Calendar panels. Crypto tickers link to the crypto view of the Setups Table automatically. The tape switches between equities and crypto based on your active universe selection, and prices update on a short polling interval so values stay current throughout the session.Core panels
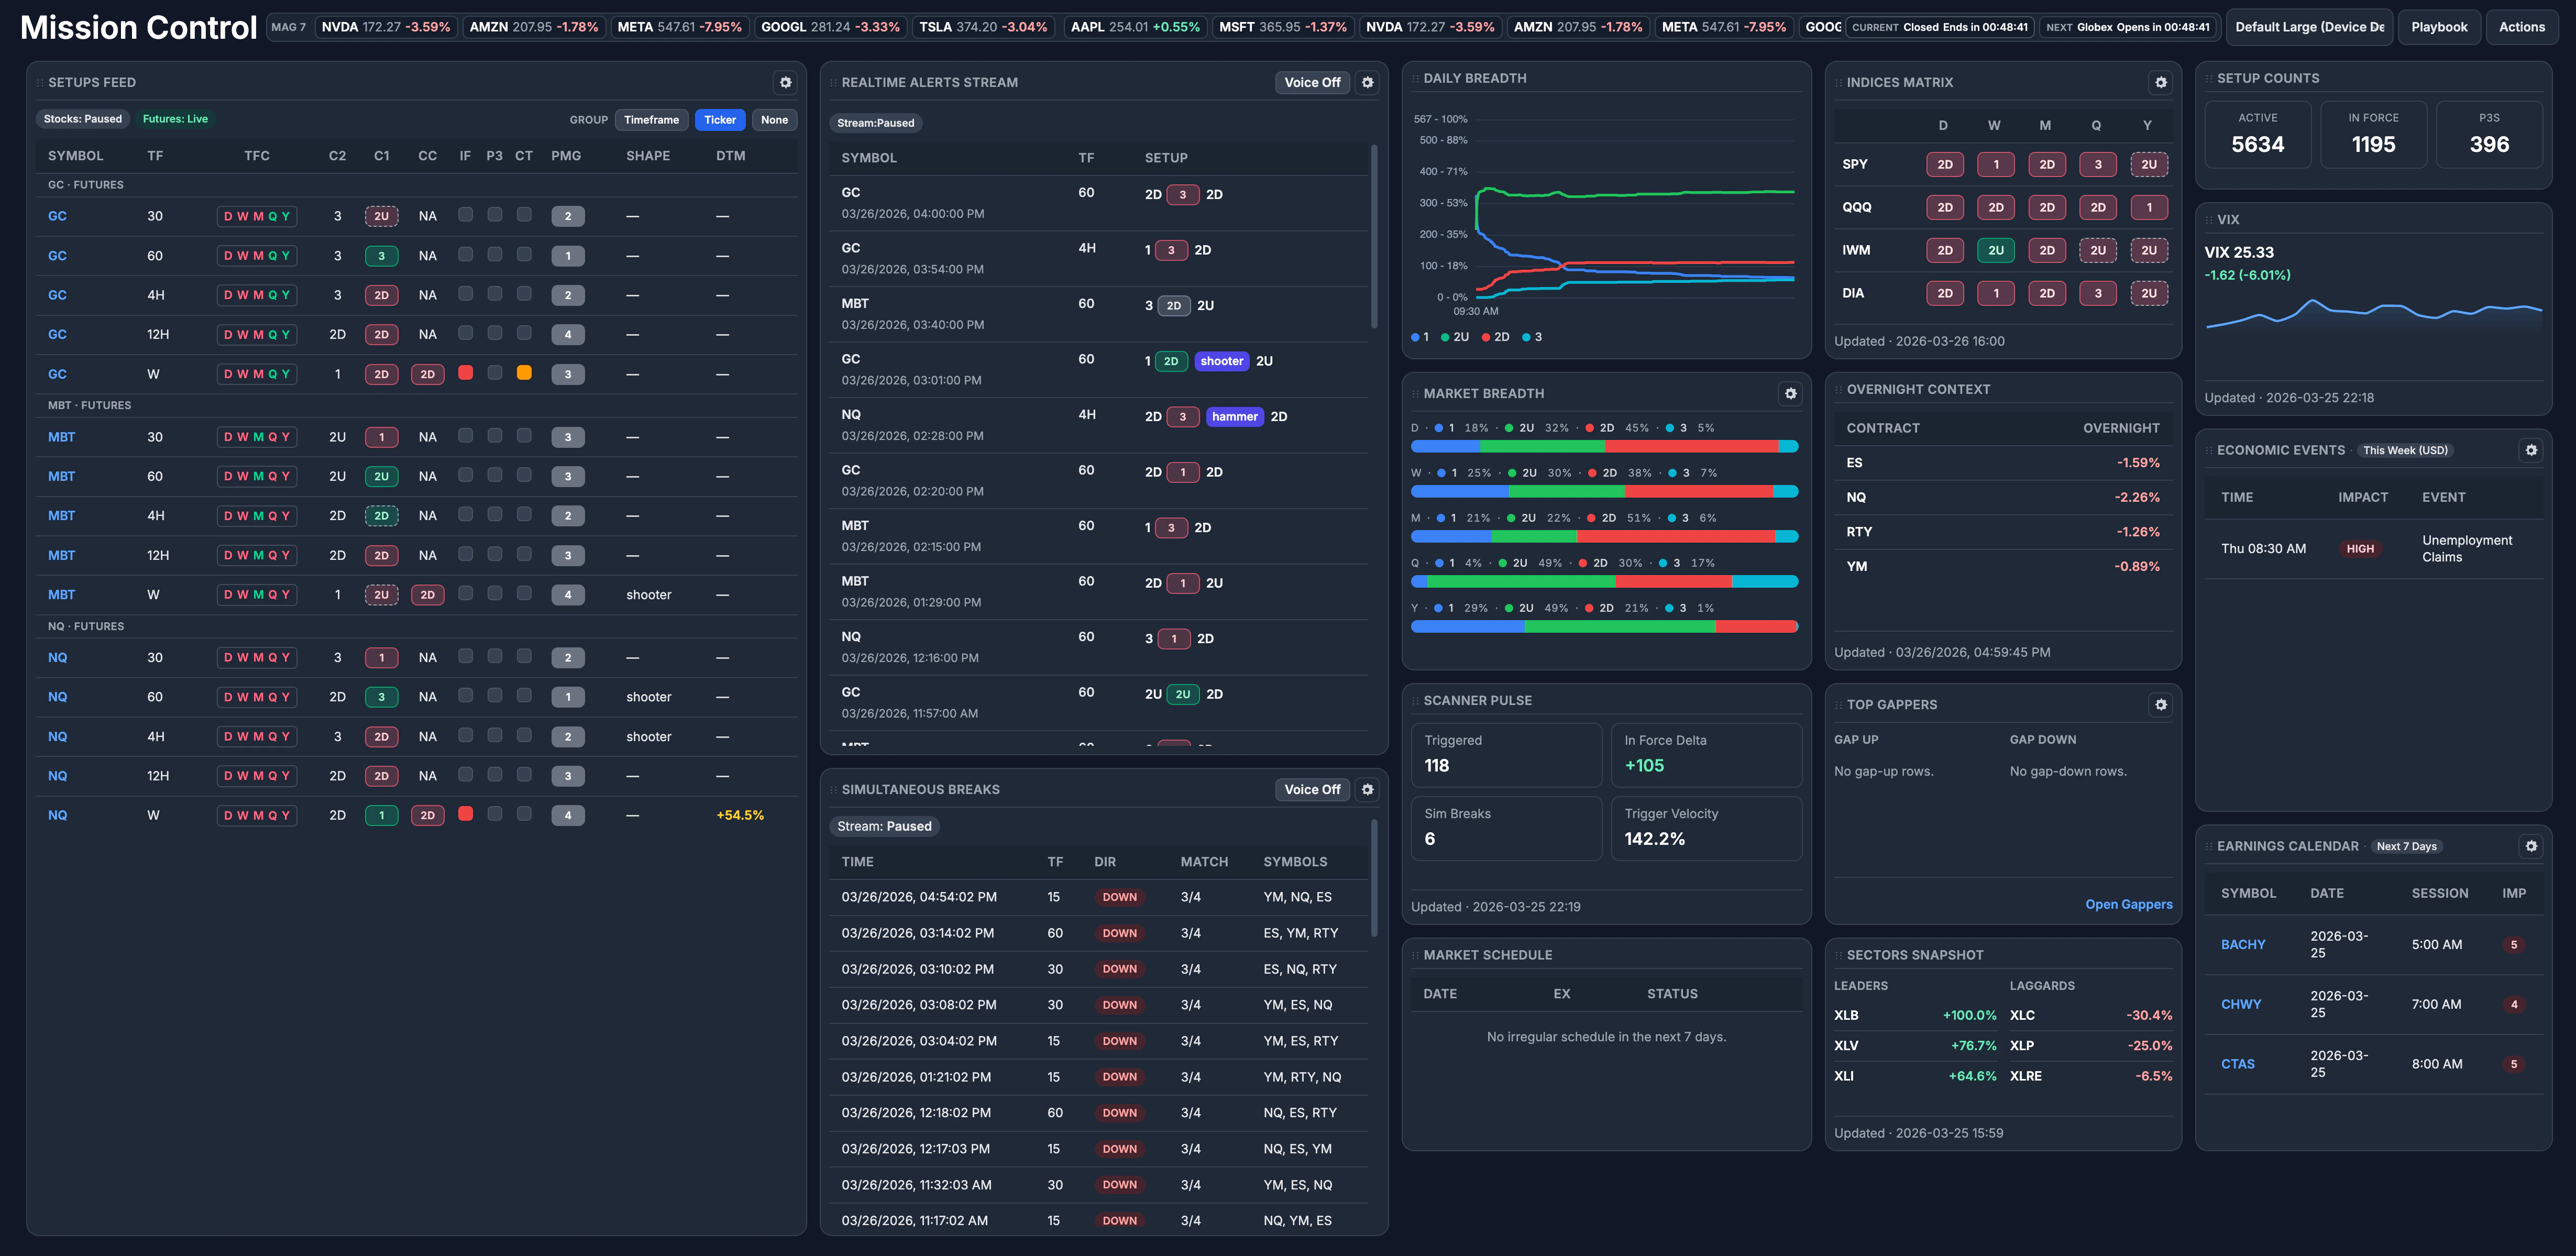
Mission Control ships with over 30 panels organized into categories. Use the Add Panels chooser to browse available panels by category, read descriptions, and add them to your layout. Below are the core (equities and futures) panels.Realtime
Alerts stream
Displays in-force alerts the moment a setup triggers. Each row shows the symbol, a dedicated Detected column with a time-only
HH:MM:SS timestamp, timeframe, and setup sequence — keeping the table compact and scannable during fast-moving sessions. New alerts push to the top so the freshest signals are always visible first. The stream uses cursor-based reconnection to replay missed alerts after a disconnect, so your view stays accurate without manual refreshes.Simultaneous breaks
Flags when multiple index futures (ES, NQ, RTY, YM) break the same direction within the same detection window. Each row opens with a Detected column showing a time-only
HH:MM:SS timestamp so you can quickly judge how tightly clustered the breaks were. Coordinated moves appear here as soon as the threshold is crossed.Metrics Alerts
Streams live events from your active metric alert rules — RVOL spikes, VWAP band touches, ATR High/Low proximity, Initial Balance breaks, ORB breaks, and RSI superstacks — directly inside Mission Control. The panel shows a compact four-column table (Rule, Symbol, Event, Detected) and connects to the same websocket feed used by the standalone Metrics page, so events appear simultaneously in both places.
Setups and scanners
Setups feed
A scrollable, real-time view of active setups across the scanned universe. Each row includes candle state (C2, C1, CC), in-force status, P3 flag, and PMG level so you can read a setup at a glance without opening the full table. Click any ticker to open the Setups Table filtered to that symbol across all timeframes, so you can drill into the full setup context without manually entering filters. Futures and crypto rows link directly to their respective market views. The feed auto-refreshes on a short interval while the tab is visible, so expired setups drop out without a manual reload.
Top Gappers
Stocks with the largest price gaps from the previous close, ranked by gap size, to help you spot potential opening moves. Kicker gaps are flagged separately.
Top Movers Into Trigger
Ranks pre-trigger setups by how close price is to the trigger level and how fast the current bar is moving toward it — useful for catching setups about to go in force.
Relative Strength
Ranks stock setups by session-strength spread versus SPY or a sector ETF, helping you identify names outperforming or underperforming the benchmark.
Biggest Movers
Tracks the largest percentage moves across core equities, futures, and crypto in real time. Sortable timeframe columns let you compare moves across intraday and daily windows, and matrix-style colored chips make direction obvious at a glance.
Scanner Pulse
High-level scanner activity and flow across your watch universe, giving you a sense of how active the setup landscape is right now.
Breadth and internals
Market breadth
Shows the distribution of candle types (1, 2U, 2D, 3) across timeframes, giving you a directional read on how broad or narrow participation is before you commit to a trade.
Indices and Ticker Matrix
Timeframe continuity and candle type for the major indices (SPY, QQQ, DIA, and IWM), or a custom watchlist of tickers. Both static and dynamic watchlists appear in the filter dropdown, so you can scope the matrix to a rule-based symbol set that updates automatically after the close.
Sector Performance Matrix
Track all major sectors at a glance with sortable timeframe columns to identify the leaders and laggards.
Sectors Snapshot
A fast sector-level view showing which groups are leading or lagging at a glance.
Setup Counts
Setup counts broken out by direction and timeframe, so you can see how many bullish or bearish setups are active across the scanned universe at any given moment.
Daily Breadth
Daily breadth charting to frame trend strength and reversals over time.
Calendar and events
Economic Events
Stay informed about upcoming market-moving events like FOMC, PPI, jobless claims, Fed speakers, PMI, and consumer sentiment.
Earnings Calendar
See which companies report earnings for the week, filtered by level of importance. Click any symbol to open the Setups Table filtered to that ticker across all timeframes, so you can review the setup landscape before or after an earnings event without leaving Mission Control.
Utility and context
Overnight Context
An overview of how the futures indices (ES, NQ, YM, and RTY) traded overnight, using quote-native prior-close percentages that match live futures quote widgets.
VIX
A compact VIX visualization with a 7-day chart, numeric labels, and hover values so you can gauge volatility conditions without leaving the dashboard.
Current Candle Snapshot
A compact snapshot of where the current candle sits across timeframes for the instruments you’re watching.
Market Schedule
Current and upcoming market session timings at a glance — Globex, Asia, London, and New York — with session countdown badges in the header.
News and audio
FinancialJuice News
Latest FinancialJuice macro headlines inside Mission Control, so you can monitor news flow without leaving the dashboard.
FinancialJuice Voice
FinancialJuice squawk controls and playback directly in the dashboard for live audio news during your session.
Crypto panels
Mission Control includes a dedicated crypto universe with panels tailored for cryptocurrency markets. Switch to the crypto view using the market selector or add crypto-specific panels alongside your core panels.Crypto Majors Tape
Live tape for major crypto pairs and market leaders, showing real-time price action as it happens.
Crypto CC Matrix
Current candle classifications for major crypto pairs across multiple timeframes, similar to the core Ticker Matrix but tuned for the crypto universe.
Crypto Top Movers
Top moving crypto pairs with fast relative performance, helping you spot momentum in the crypto market.
Crypto OI Change Leaders
Open-interest leaders showing notable derivatives positioning shifts, useful for gauging leveraged sentiment.
Crypto Fear & Greed
Crypto sentiment context from the Fear and Greed Index, giving you a quick read on market psychology.
Crypto Global Market
Global crypto market cap and participation context to frame whether the broader crypto market is expanding or contracting.
Crypto Setup Counts
Setup counts tuned for the crypto universe and key timeframes.
Crypto Breadth
Crypto breadth overview to see how broad or narrow participation is across the crypto market.
Crypto Derivatives Flow
Derivatives-flow snapshot for liquidation and leverage context across crypto markets.
Panel chooser
Click Add Panels to open the panel chooser modal. Panels are grouped by category — Realtime, Setups/Scanners, Breadth/Internals, Calendar/Events, Utility/Context, and News/Audio — with thumbnail previews and descriptions so you can browse what’s available before adding anything to your layout. Panels you’ve already added are marked, and subscription-locked panels show a lock icon with a prompt to upgrade.Biggest Movers
The Biggest Movers panel surfaces the stocks, futures, and crypto instruments with the largest percentage price moves in real time. It is available for both the core (equities and futures) and crypto markets.What the panel shows
What the panel shows
Each row displays a symbol and its percentage change across multiple timeframe columns. The values render as matrix-style colored chips — green for positive moves, red for negative — so you can read direction without parsing numbers. Columns are sortable: click any timeframe header to rank the universe by that window’s move size.
Timeframe and row-count controls
Timeframe and row-count controls
The panel includes selectable timeframe chips — 15m, 30m, 60m, 4H, 12H, D, W, M, Q, Y — so you can choose which windows appear as columns. A numeric row-count input lets you show anywhere from 1 to 25 symbols at a time, keeping the panel compact or expanded depending on how much screen space you want to dedicate. Your custom row count is saved per layout, so a value like 22 persists across sessions. These preferences reset to the default set (60m, 4H, D, W, M) when you clear the panel state.
Filtering by market
Filtering by market
Use the toggle at the top of the panel to switch between core (equities and futures) and crypto views. Within the core view, you can further toggle visibility between equities and futures to focus on one asset class at a time.
When to use it
When to use it
Check Biggest Movers during a session to identify names with outsized momentum. A stock making the biggest daily move may be reacting to a catalyst worth investigating, and seeing which timeframe is driving the move helps you decide whether the momentum is intraday noise or a developing trend.
Sector Performance Matrix
The Sector Performance Matrix panel tracks percentage moves for all major sectors across multiple timeframes, giving you a quick read on which sectors are leading or lagging.Sort behavior
Sort behavior
Click any timeframe column header to sort sectors by that window’s performance. Your sort selection persists across live data refreshes — the panel won’t snap back to a default sort every time new data arrives. If you sort by a timeframe column that later becomes hidden, the sort falls back to a visible column instead of breaking silently. Click Reset to restore the default D (daily) descending sort.
Timeframe and sector chip selection
Timeframe and sector chip selection
Use the timeframe chips at the top of the panel to choose which columns are visible. When all timeframes are selected, the chips show a filled All state. Deselecting individual chips narrows the view. The same pattern applies to sector chips if you want to focus on a subset of sectors. Your selection is preserved across data refreshes.
Setups Feed drag reordering
When the Setups Feed is grouped by ticker, you can drag ticker-group sections into a custom order. Grab a group header and move it up or down — a bright insertion bar tracks the exact drop edge so you can see where the group will land before you release. Your custom order is saved per layout and persists across page reloads, live data refreshes, and filter changes.How it works
How it works
Each ticker group in the feed has a drag handle on its header row. Click and hold the handle, then drag the group to a new position. The feed highlights the target location with a visible insertion bar and a stronger background highlight on the drop zone. Release to confirm the new order.The reordered arrangement is saved immediately to your layout preferences. Live websocket refreshes and short-interval data updates respect your custom order — the feed does not snap back to a default sort when new data arrives.
When to use it
When to use it
Use drag reordering to pin the symbols you care about most to the top of the feed. If you always want to see
NQ=F and ES=F first during a futures session, drag those groups to the top and they stay there — even when other symbols are temporarily filtered out and reappear later.Interaction with playbooks
Interaction with playbooks
Your drag order is scoped to the current layout. When you save and reapply a playbook, the Setups Feed restores the ticker-group order that was active when the playbook was saved. Switching between playbooks swaps the group order along with your other filter and panel preferences.
Metrics Alerts panel
The Metrics Alerts panel gives you a compact, live stream of events from your active metric alert rules without leaving Mission Control. It reuses the same websocket feed as the standalone Alerts → Metrics page, so every event that appears there also appears here — no separate configuration required.What the panel shows
What the panel shows
The panel renders a fixed four-column table:
Columns like observed value, threshold, and timeframe are omitted to keep the panel compact. Open the standalone Metrics page when you need the full event detail.
Window setting
Window setting
The panel includes a single preference: the rolling time window that controls how far back events are shown. Available windows are 15 minutes, 30 minutes, 1 hour, 2 hours, and 4 hours. The default is 30 minutes. Your selection is saved per layout, so different layouts can use different windows.Open the panel settings (gear icon in the panel header) to change the window.
Voice announcements
Voice announcements
The Metrics Alerts panel has its own Voice On/Off toggle in the panel header, separate from the Realtime Alerts and Sim Breaks voice toggles. When enabled, your browser speaks each new live event in the format
<symbol> <timeframe-or-session> <event label> — for example, TSLA 60 minute are vol entered high or NQ Globex initial balance bull break.The toggle is off by default. Click Voice Off in the panel header to enable it; click Voice On to mute. Your preference is saved server-side alongside your other Mission Control voice settings, so it persists across devices and is captured in playbooks.Speech transformations are tuned for trading symbols and rule names:- Symbols — futures
=Fsuffixes andUSDT/1000crypto modifiers are stripped. Pronounceable tickers (e.g.,TSLA) are read as words; non-pronounceable tickers (e.g.,MSFT) are spelled letter by letter. - Timeframes —
15/30/60are spoken as “15 minute” / “30 minute” / “60 minute”;4Hand12Has “4 hour” and “12 hour”;D,W,M,Q,Yas “daily”, “weekly”, “monthly”, “quarterly”, “yearly”. Sessions like Globex, NY, and London are spoken as-is. - Event labels — common indicator prefixes are pronounced naturally:
rvol→ “are vol”,atr→ “a t r”,rsi→ “r s i”,vwap→ “vee whop”,ibal→ “initial balance”,orb→ “orb”.
When to use it
When to use it
Add the Metrics Alerts panel when you want to monitor metric-based signals alongside your setup alerts and breadth panels in one view. If you already have RSI superstack, RVOL, VWAP, Initial Balance, ATR High/Low, or ORB rules configured under Alerts → Metrics, this panel surfaces those events in real time without switching pages. Enable the panel’s voice toggle when you want to step away from the screen and still hear new metric events as they fire.
Working through the session
1
Open Mission Control
Press M to navigate directly to Mission Control. You can also access it from the main navigation. The page loads with your last-used filter state intact.
2
Watch the alerts stream
As setups go in force, alerts appear in real time. Each row shows the symbol, a Detected timestamp in
HH:MM:SS format, timeframe, and setup sequence. The stream is chronological — most recent first.3
Check simultaneous breaks
When two or more index futures break in the same direction within the detection window, the simultaneous breaks panel updates immediately. A threshold badge (2/4, 3/4, or 4/4) shows how many instruments are participating.
4
Read the setups feed
Scan the setups feed for names that match your criteria. The feed reflects the same data as the full Setups Table but presents it in a compact, continuously updating view built for monitoring, not deep filtering. Click any ticker to jump to the Setups Table filtered to that symbol across all timeframes for deeper analysis.
5
Use breadth as a backdrop
Before acting on an alert, glance at the breadth panel. Trading in the direction of the most 2s — and 2s going 3 — is a core principle of the Strat methodology. Breadth tells you whether conditions support that direction broadly or only in isolated names.
Layouts and sharing
You can create multiple saved layouts, each with its own panel arrangement and sizing. Clone a layout to experiment without losing your current setup, or set a layout as your primary so it loads by default. To share a layout with another user, generate a short-link code from the layout menu. Anyone with that link can import the layout into their own account. Panels the recipient doesn’t have access to are silently stripped so the layout still loads cleanly.Playbooks
Layouts control how your dashboard looks. Playbooks control how your scanner behaves. A playbook saves the active filters, panel preferences, timeframe selections, watchlist selections, and scanner voice settings as a reusable preset. Applying a playbook changes the scanner’s operating mode without rearranging your panels — your workspace structure stays intact while the focus shifts instantly. Watchlist filters on the Setups Feed are preserved when you save and reapply a playbook, so switching back to a watchlist-based playbook restores the expected ticker list. Use playbooks when you want one layout to serve multiple scanning routines — for example, an intraday mode with shorter timeframes and tighter thresholds, a swing mode with broader filters, or a sector-focused scan. See the Playbooks page for full details.Market filter
The setups feed on Mission Control can be scoped by asset class. Use the market selector to switch between Stocks, Futures, Crypto, or the default All view. Your selection narrows the symbols shown in the feed and in the alerts stream.The simultaneous breaks panel always watches ES, NQ, RTY, and YM regardless of your market filter. Those four instruments are the cohort used for detection.
Watchlist filters
The setups card, alerts card, and ticker matrix each include a watchlist filter dropdown. Select any of your watchlists — static or dynamic — to scope that panel to only the symbols on that list. Dynamic watchlists are labeled in the dropdown so you can tell them apart from manually curated lists. This is especially useful with dynamic watchlists: define a set of filter rules once, and the resulting symbol list automatically feeds into your Mission Control panels each session without manual updates.Panel availability
Not every panel is visible to every user. Panel access depends on your subscription tier and rollout status.By subscription tier
Basic plan subscribers can access the Mission Control dashboard, but four panels are reserved for the Founders Plan:- Alerts stream — Founders Plan only
- Simultaneous breaks — Founders Plan only
- Sectors snapshot — Founders Plan only
- Sector performance matrix — Founders Plan only
By rollout status
- General availability — most panels are visible to all paid users and appear in the chooser by default.
- Beta panels — panels being tested may be available only to beta testers. If you’re a beta tester, these panels appear in the chooser alongside general-availability panels. Other users won’t see them.
- Staff-only panels — a small number of panels are reserved for staff. These never appear in the chooser for non-staff users.
If a panel you expected to see is missing from the chooser, it may require the Founders Plan or be in a restricted rollout. Check the pricing page to compare plans, or reach out to support.