> ## Documentation Index
> Fetch the complete documentation index at: https://docs.stratalerts.com/llms.txt
> Use this file to discover all available pages before exploring further.
# Setups Table
> The Setups Table shows every active Strat setup across all scanned instruments. Sort, filter by sequence or timeframe, save views, and run AI Search queries.
The full Setups Table requires an active **Basic** or **Founders Plan** subscription. Free accounts can browse a limited view, but filtering, saved views, and AI Search require a paid plan. [Compare plans →](/pricing)
## Filter and Browse Active Strat Setups
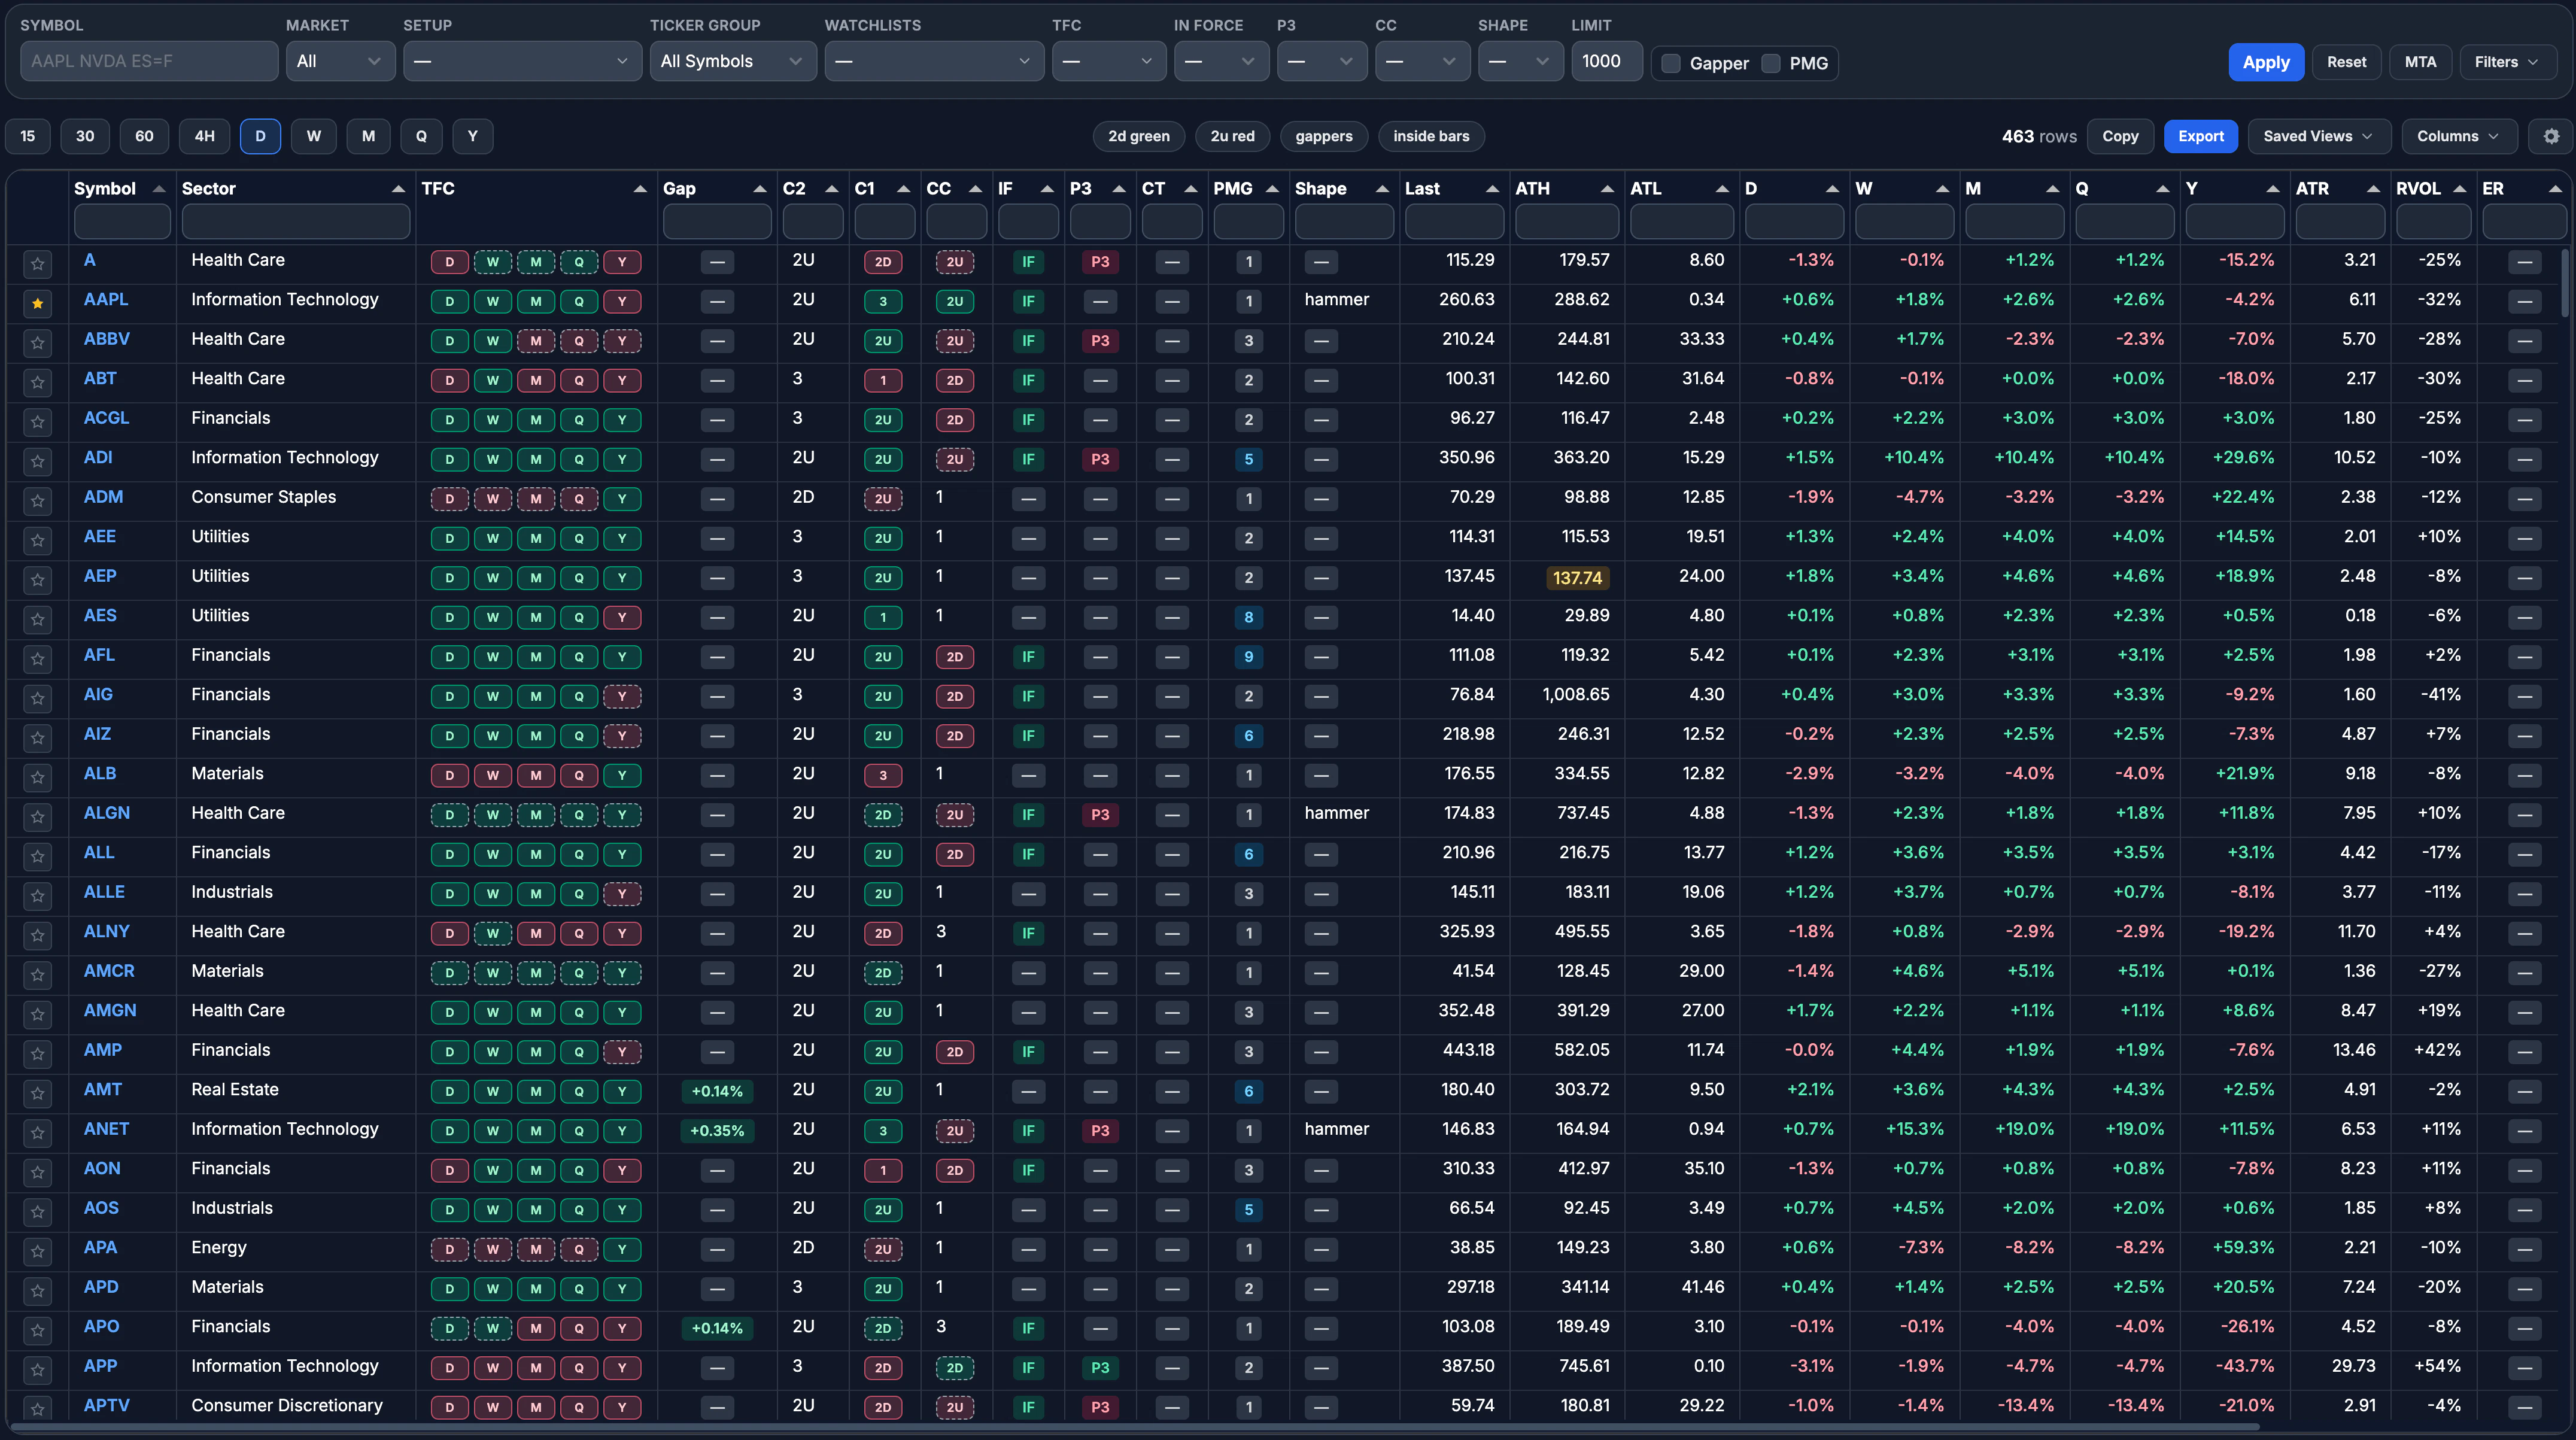
The Setups Table is where you go when you want to scan broadly rather than react to a single alert. It presents every active setup across the entire universe — stocks, futures, and crypto — in a sortable, filterable grid. Press **S** anywhere in the app to open it directly.
## Columns at a glance
Each row represents one active setup on one timeframe. The table ships with a default column set you can reorder and hide to fit your workflow.
**Symbol** is the ticker. **TF** (Timeframe) is the candle period the setup lives on — 15m, 30m, 60m, 4H, 12H, D, W, M, Q, or Y. Most traders focus on daily and higher timeframes for swing setups and intraday timeframes for session-day entries.
Shows the alignment of directional candles across higher timeframes. A fully green TFC column on a daily setup means the weekly, monthly, quarterly, and yearly candles are all pointing the same direction — a strong tailwind for the trade.
**Failed-state chips** are flagged with a distinct visual treatment when a timeframe's TFC color contradicts its candle state — a green chip displaying a `2D` candle, or a red chip displaying a `2U`. These signal a higher-timeframe candle that has failed against the prevailing continuity, which often precedes a reversal or compression. Use failed-state chips as a heads-up that the trend on that timeframe is breaking down, even if the broader TFC stack still looks aligned.
The three-candle setup structure: **C2** is the target candle (the one you're aiming for), **C1** is the trigger candle (the one whose high or low gets breached to activate the setup), and **CC** is the current candle forming right now. Each cell shows the candle ID: 1 (inside), 2U (up), 2D (down), or 3 (outside).
A setup goes in force when price breaks above the trigger high (bullish) or below the trigger low (bearish). The **IF** column flags setups that are currently active — price has already crossed the trigger level and the trade is live.
The **P3** flag marks setups where the current candle is a 3 (outside bar), creating a potential three-candle outside bar setup. P3 setups in force carry elevated urgency because an outside bar can resolve quickly in either direction.
**PMG** shows the price level where the setup reaches its maximum potential gain — typically the magnitude level derived from the target candle's range projected outward. It gives you a reference for where the move could go if it runs.
The candlestick pattern of the trigger candle — hammer, shooter, doji, or standard. Shape context helps you evaluate the quality of the trigger before acting.
**ATR** (Average True Range) quantifies expected daily movement. **RVOL** shows relative volume compared to the 10-day average, displayed as a plus or minus deviation. High RVOL alongside a trigger often means participation is expanding.
**Vol** is the symbol's session volume so far, formatted compactly (for example, `1.23M` or `45.6K`). It updates throughout the regular session and gives you a quick read on whether participation is unusually heavy or light alongside RVOL.
**PM Vol** is the cumulative pre-market volume for the current session, sourced from real-time stock aggregate trades during the 4:00 AM ET to 9:30 AM ET pre-market window. It's available for equities only — futures and crypto rows leave the column empty. Use it alongside the **Gap** column to confirm that pre-market gaps are backed by real participation rather than a few thin prints.
Both columns are sortable and accept numeric header filters (for example, typing `1000000` shows only rows with at least 1M volume). They're hidden by default on narrow layouts — right-click any column header to toggle them on. The PM Vol value persists through the regular session so morning context stays visible all day.
The **Gap** column shows the signed premarket gap percentage for each symbol. Kicker gaps — unusually large moves relative to recent range — are highlighted with an orange ring so they stand out. Hover over a ringed chip to see a **Kicker** tooltip confirming the flag. Use this column alongside the **Gapper** filter to focus on names gapping into potential setups. See the [gappers scanner](/scanner/gappers) page for details on how gaps and kickers are detected.
**ATH** (All-Time High) and **ATL** (All-Time Low) columns show how close the current price is to the historical extremes. Available for equities and crypto. Use the **Near ATH** or **Near ATL** filter to surface symbols approaching these levels — breakouts at all-time highs or reversals at all-time lows often attract heavier participation.
**Sector** groups the symbol into its SPDR sector for context. **ER** (Earnings) badges flag symbols with earnings inside the current weekly window so you can factor event risk before entering.
## Filtering setups
The filter panel above the table lets you narrow the universe to exactly the setups you care about. Filters stack — combine as many as you need. Admins can also edit the same filters in the [filter modal](#filter-modal) launched from the toolbar when they want a larger, focused view of every control.
Pick a C2-C1 or C2-C1-CC sequence from the setup dropdown: for example, **1-2U** (inside day into up candle), **2D-3** (down candle into outside bar), or **1-2-2** (inside day, two-candle sequence into another two). The filter expands shorthand entries automatically — typing `2` matches both `2U` and `2D` continuations.
Filter by the state of the current candle: **1** (inside), **2U**, **2D**, **3**, **2D-green** (failed bearish), **2U-red** (failed bullish), **3-green**, or **3-red**. The detail values let you filter on candle color as well as candle type.
Scope the table to a single timeframe or click **All** to view setups across every timeframe at once. This is useful when preparing for the open and you only want to see daily setups, or during the session when you're scanning 60m names.
Toggle the **In-Force** filter to show only setups where price has already cleared the trigger. These setups are live trades, not pending ones.
A continuation occurs when C1 and CC are the same directional 2 candle (e.g., 2U trigger with a 2U current candle). Toggle **Hide Continuations** to remove these from the table and focus on fresh triggers instead.
Use the **Favorites** filter to restrict the table to symbols on your watchlists. Use the **Gapper** filter to surface symbols showing significant pre-market gap moves — useful for morning setups. Kicker gaps are flagged separately for outsized moves. Learn more about how gap detection works on the [gappers scanner](/scanner/gappers) page.
The **C2 Color** and **C1 Color** filters let you narrow results by the color of the target or trigger candle — for example, only setups where C1 closed green (bullish trigger) or C2 was red (bearish target). Candle-color filters are preserved in saved views.
## Filter modal
The **Filters** toolbar button that opens this modal is currently gated to superuser accounts while we finish rolling out the roomier layout. The persistent filter panel above the table — and the mobile slide-over drawer — remain available to everyone, with the same controls. If you don't see the **Filters** button in the desktop toolbar, you have full access to the same filters from the panel directly above the table.
The persistent filter panel above the table stays visible on desktop, so the controls you reach for most are always one click away. When you want a roomier layout — for example, when reviewing every filter at once or working on a smaller laptop screen — superusers can open the **Filters** modal from the toolbar above the table.
Click **Filters** in the toolbar (next to the row count and pagination). The button only appears for superuser accounts. The modal opens centered on screen and temporarily hosts the same filter form used by the persistent panel.
The modal lays the controls out in a condensed three-column grid with inline labels — symbol, market, ticker group, and watchlists on the left; In-Force, TFC, P3, C1 shape, and CC in the middle; and a combined market-cap min/max row, C2/C1 color, near extremes, earnings, hide continuations, and limit on the right. Advanced filters appear inline alongside the rest of the controls, so the **Advanced** toggle from the persistent panel is hidden while the modal is open. The setup-sequence dropdown is the one persistent-panel control that's omitted from the modal — keep using the persistent panel for that. Anything you change is applied to the same underlying form.
Submit the form to reload the table with the new filters, or click the **×** in the modal header to dismiss it. The persistent panel reflects the same state as soon as the modal closes.
The modal is a desktop convenience layer on top of the existing panel — not a replacement. On phones and small tablets the filters still open as a full-screen slide-over drawer from the **Filters** button in the mobile toolbar.
## Sorting
Click any column header to sort the table by that column. The first click sorts in descending order, the second sorts in ascending order, and the third clears the sort.
### Multi-column sorting
Hold **Shift** and click additional column headers to stack multiple sorts at once. The table uses the order you clicked — the first column you sort on stays the primary sort, and each subsequent **Shift**-click adds a secondary, tertiary, and so on.
When sorting by change-percent columns across several timeframes, click the broadest timeframe first and work inward. For example, **Shift**-click **Y**, then **Q**, then **M**, then **W**, then **D** to keep yearly as the primary sort and daily as the last tiebreaker. This way, the broader trend context stays dominant.
Multi-column sorting is especially useful for finding symbols that are trending consistently across timeframes — sort by yearly first, then quarterly and monthly, and the top rows will show names with strong alignment from macro down to micro.
## Saved views
Once you've built a filter combination you use regularly, save it as a named view.
Set up the combination of setup sequence, CC state, timeframe, and other filters that defines the view you want to save.
Click the save icon in the filter bar and give the view a name. Your saved views appear in the views menu and persist across sessions.
Open the **Views** dropdown to see all your saved views. Each row has an **Apply** button to load that view's filters and a **Delete** button to remove it. You can delete any view directly from the list without needing to select it first.
Frequently used views can be pinned to the filter toolbar as chips. One click activates the full filter state — no need to open the views menu.
Saved views are available to all logged-in users — no active subscription is required. You can create, update, and delete views as soon as you have an account.
Good candidates for saved views: "Daily in-force," "Weekly P3 setups," "Intraday 1-2U," or "Stocks only, no continuations." Build views that match your actual session workflow so switching between contexts takes a single click.
## AI Search
Click the **wand button** (✦) next to the gear menu in the toolbar to open AI Search, or press **Q** on your keyboard. The AI Search bar accepts natural language queries and translates them into table filters for you. Instead of manually selecting options, type what you're looking for.
AI Search understands Rob Smith's Strat terminology natively — candle IDs (`1`, `2U`, `2D`, `3`), failed states (`failed 2D`, `failed 2U`), setup sequences (`1-2U`, `2D-3`, `1-2-2`), and qualifiers like "in force," "continuation," or "gapper" all work as expected. A bare `2` expands to match both `2U` and `2D`.
**Example queries:**
* `all inside days` — shows setups with a 1 (inside) candle on the daily timeframe
* `2U weeks in force` — weekly setups where C1 is 2U and price is above the trigger
* `daily outside bars going up` — daily 3 candles with an up direction flag
* `1-2U intraday with high volume` — 15m through 4H setups matching that sequence, sorted by RVOL
* `1-2D green on the daily` — daily 1-2D setups where the trigger candle (C1) closed green
* `red C2 on the weekly` — weekly setups where the target candle is red
* `week and month are 2U` — multi-timeframe query returning symbols that are 2U on both weekly and monthly
* `day in force and week in force` — symbols in force on both the daily and weekly timeframes
When you include a candle color like "green" or "red" alongside a setup sequence, AI Search applies the color to the trigger candle (C1) by default. To target the target candle instead, say "green C2" or "red target candle" explicitly.
## Multi-timeframe analysis (MTA)
MTA mode lets you walk through a sequence of timeframe conditions step by step to find symbols that meet requirements at multiple levels simultaneously.
Click **MTA** in the filter area to open the step builder. Each step represents one timeframe condition. The base table's own filters act as Step 1; click **Add Step** to stack additional steps on top.
For each step, choose a timeframe and the conditions you want — for example, Step 1: Weekly 2U in force. Step 2: Daily 1 candle. The builder lets you chain as many steps as you need. Click **Apply MTA** to run the analysis.
The table returns only symbols that satisfy every step simultaneously. A name that is weekly 2U in force with a daily inside bar is a much higher-conviction candidate than one that only meets one condition.
### Per-step candle filters
Each step exposes the same filter set as the base table, organized into two rows so you can dial in a specific candle structure on every timeframe:
**Primary row** — top-level filters that define the setup itself:
| Filter | Options |
| --------- | ----------------------------------------------------------- |
| **TF** | 15m, 30m, 60m, 4H, 12H, D, W, M, Q, Y |
| **Setup** | Multi-select of setup combos (e.g., `1-2`, `1-2-2`, `2D-3`) |
| **IF** | In-force only |
| **P3** | Three-candle outside bar (`up`, `down`, or any) |
| **Shape** | C1 candle shape — `hammer` or `shooter` |
**State row** — per-candle structure and color filters for the three candles in the setup:
| Filter | Options |
| ------------ | -------------------------------------------------------------- |
| **C2** value | `1`, `2U`, `2D`, `3` |
| **C2** color | `green`, `red` |
| **C1** value | `1`, `2U`, `2D`, `3` |
| **C1** color | `green`, `red` |
| **CC** value | `1`, `2U`, `2D`, `3`, `2D-GREEN`, `2U-RED`, `3-GREEN`, `3-RED` |
| **CC** color | `green`, `red` |
Any field left on **All** matches everything for that timeframe, so you can isolate exactly the structure you want without overconstraining the step. Filters apply independently per step — a green C1 on the weekly does not constrain C1 color on the daily.
### Example
Find symbols that are bullish on the weekly with a fresh inside-bar trigger on the daily:
* **Step 1** — TF: **W**, Setup: `1-2U`, IF: on, C1 color: **green**
* **Step 2** — TF: **D**, CC: **1** (inside)
The table shows only names that satisfy both conditions at once. Continuations are hidden by default so a higher-timeframe `1-2` step does not match symbols already showing the same direction on a lower timeframe.
### Saved views
MTA configurations save with your views. The view summary captures each step compactly — for example, `W: 1-2U · IF · C1 green | D: CC 1` — so you can tell at a glance what a saved MTA scan does before applying it.
MTA works best when you lead with a higher timeframe direction and let lower timeframes provide the entry trigger. A weekly 2U in force gives you the bias; a daily 1 candle gives you the setup to watch.
## Guided tour
The first time you open the Setups Table on a larger screen, a guided walkthrough appears. The tour walks you through the core controls — timeframe selectors, filters, saved views, columns, and the MTA builder — and creates a real **Inside Bars** saved view with a toolbar chip so you can see how saved views work in practice. Your existing filters, sort order, and layout are saved before the tour starts and restored when it ends, so nothing is lost.
You can skip or exit the tour at any time. A replay hint appears near the gear menu afterward in case you want to run through it again later.
The tour is a good starting point if you're new to the scanner. It covers the same workflow most experienced users follow: pick a timeframe, narrow with filters, save the view, and optionally layer MTA steps for multi-timeframe conviction.
## Mobile layout
The Setups Table adapts to smaller screens with a mobile-optimized layout. On phones, the timeframe row scrolls horizontally, the top bar condenses into a compact row count, filters, and actions strip, and filter and action panels open as full-screen drawers with explicit close buttons. Column resizing is locked on touch devices so horizontal scrolling works without accidentally grabbing a resize handle.
Saved views, column controls, and the reset action are accessible from the **Actions** menu on mobile, which opens as a popover that stays on-screen.
The Setups Table requires you to be logged in. If you visit the page while signed out, you are redirected to the login screen.
## Column customization
Right-click any column header to toggle visibility or drag headers to reorder them. Your layout preferences are saved automatically and persist across sessions for each asset class (core markets and crypto are saved separately).
When viewing setups across all timeframes at once, a dedicated **TF** column appears next to **Symbol** so you can tell which timeframe each row belongs to without changing the normal single-timeframe layout.
## Table help
Open the gear menu (⚙) at the top-right of the table and click **Table Help** to view a quick-reference modal that covers sorting and header-filter syntax. This is useful when you can't remember the exact filter format for a column type.
The modal covers:
* **Sorting** — single-click, Shift-click stacking, and the recommended broad-to-narrow timeframe order.
* **Text columns** — case-insensitive contains match. Typing part of a value is enough.
* **Numeric columns** — plain numbers like `50` are treated as "greater than or equal to" for columns such as **Last**, **ATH**, **ATL**, and **ATR**.
* **Change-percent columns** (D / W / M / Q / Y) — signed thresholds. `5` means "at least +5.0%", while `-5` means "at most −5.0%".
* **RVOL** — filters by absolute magnitude. `20` matches values at or beyond +20% or −20%.
* **Boolean columns** (IF, CT, ER) — accepts `true`/`false`, `t`/`f`, `y`/`n`, or `1`/`0`.
* **P3** — accepts its text values like `up` and `down` in addition to boolean shortcuts.
* **Gap** — accepts explicit comparisons like `>=5` or `<=-3`. A plain number matches either direction by magnitude.
Header filters run inside the table grid itself. They work independently from the top filter bar and can be combined with it for precise control.
## Keyboard shortcut
| Key | Action |
| ----- | ---------------------------------------------- |
| **S** | Open the Setups Table from anywhere in the app |
 The Setups Table is where you go when you want to scan broadly rather than react to a single alert. It presents every active setup across the entire universe — stocks, futures, and crypto — in a sortable, filterable grid. Press **S** anywhere in the app to open it directly.
## Columns at a glance
Each row represents one active setup on one timeframe. The table ships with a default column set you can reorder and hide to fit your workflow.
The Setups Table is where you go when you want to scan broadly rather than react to a single alert. It presents every active setup across the entire universe — stocks, futures, and crypto — in a sortable, filterable grid. Press **S** anywhere in the app to open it directly.
## Columns at a glance
Each row represents one active setup on one timeframe. The table ships with a default column set you can reorder and hide to fit your workflow.